

 Data Driven Security Models and Analysis - April 2017
Public Audience
Purpose: To highlight project progress. Information is generally at a higher level which is accessible to the interested public. All information contained in the report (regions 1-3) is a Government Deliverable/CDRL.
PI(s): Ravi Iyer
Co-PI(s): Zbigniew Kalbarczyk and Adam Slagell
Researchers: Phuong Cao and Key-whan Chung
HARD PROBLEM(S) ADDRESSED
This refers to Hard Problems, released November 2012.
- Predictive security metrics - design, development, and validation
- Resilient architectures - in the end we want to use the metrics to achieve a measurable enhancement in system resiliency, i.e., the ability to withstand attacks
- Human behavior - data contain traces of the steps the attacker took, and hence inherently include some aspects of the human behavior (of both users and miscreants)
PUBLICATIONS
Papers published in this quarter as a result of this research. Include title, author(s), venue published/presented, and a short description or abstract. Identify which hard problem(s) the publication addressed. Papers that have not yet been published should be reported in region 2 below.
Poster: Phuong Cao, Alexander Withers, Zbigniew Kalbarczyk, and Ravishankar Iyer, "Learning Factor Graphs for Preempting Multi-Stage Attacks in Cloud Infrastructure", Symposium and Bootcamp on the Science of Security (HotSoS 2017), Hanover, Maryland, April 4-5, 2017.
Abstract: This poster presents our approach to automatically learn factor graphs (a probabilistic graphical models that capture attacker behavior) employed for preemptive detection of multi-stage attacks in large enterprise networks, e.g., cloud infrastructure. We introduce mathematical underpinnings and algorithms to learn: (i) a factor graph structure that represents dependencies among observed events and hidden attack stages and (ii) factor graph parameters (i.e., factor functions) that allow quantifying the most probable stage of the attack based on a sequence of events (corresponding to system, user, and attacker activities) observed at runtime.
ACCOMPLISHMENT HIGHLIGHTS
This quarter we have continued our work on development of methods for automatic learning of factor graphs employed for preemptive detection of multi-stage attacks in large enterprise networks, e.g., cloud infrastructure. Specifically, we introduce mathematical underpinnings and algorithms to learn: (i) a factor graph structure that represents dependencies among observed events and hidden attack stages and (ii) factor graph parameters (i.e., factor functions) that allow quantifying the most probable stage of the attack based on a sequence of events (corresponding to system, user, and attacker activities) observed at runtime. The goal is to minimize manual effort involved in defining factor functions and improve the detection coverage.
1. Learning a factor graph structure
The goal of learning structure of a factor graph G = (V, E) is to automatically establish a set of dependencies among variables in a factor graph (Figure 1(a)). A dependency among two variables or a set of variables is represented by a factor function that connect variable nodes (include observed events x and hidden attack stages z). Dependencies among variables are automatically extracted from past data on security incidents. The learned dependencies are used to construct factor graphs.
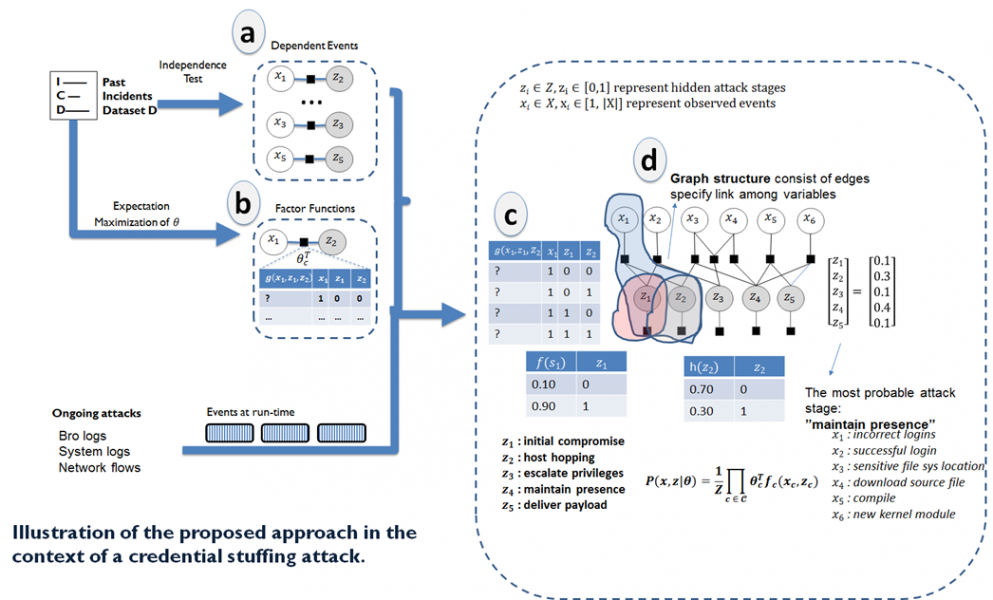
Figure 1: Learning structure and factor functions of a factor graph
- Learning statistical relationships (offline)
Given two random variables X and Y, we need to identify dependency between X and Y. One of the main challenges is that without domain-specific knowledge, one cannot establish relationship between X and Y. We address this challenge using statistical hypothesis tests (such as Chi-square test) where our null hypothesis is expressed as follows:
Null hypothesis Ho : X and Y are not dependent, i.e., knowing the value of X does not help in predicting the corresponding value of Y.
Identifying statistical relationships among pairs of random variables (i.e., events observed d at runtime and corresponding to the system/user/attacker activities), provides a set of dependencies, . Strength of each dependency is associated with a corresponding p-value. This learning of statistical relationships is performed offline and the set of dependencies is used to construct the corresponding factor graph.
Learning factor graph structure (runtime)
The goal of learning factor graph structure is to automatically apply the learned dependencies to construct a set of candidate factor graphs, . Each dependency is added to the factor graph based on a selection policy, e.g., dependency with a lowest p-value is added first. Finally, a candidate factor graph is output for evaluation (Figure 1(d)). While it is straight-forward to construct such factor graph, the main challenge is find a factor graph that is not "too complicated" and has a good fit with the data. To solve this challenge, each candidate factor graph is evaluated based on two criteria.
- Complexity of factor graph. Since each dependency has a different strength, various factor graphs can be constructed using different construction policies, e.g., a simpler factor graph using only strongest dependencies or a complex factor graph using all learned dependencies. A complex factor graph increases processing time and leads to overfitting, while a simple factor graph may not adequately capture progression of an attack. We aim to balance such factor graphs by defining an objective scoring function based on the complexity of the graph.
- Goodness of the fit w.r.t past data. A factor graph should be constructed taking into account knowledge from the past data D. For such graphs, the goodness of the fit with the training data must be maximized. Combining the two criteria, we define a scoring function for each candidate factor graph as follows.

Using this formulation, a candidate factor graph, Gc :
- Maximizes goodness of the fit with the training data using log likelihood function
 . The likelihood function is a sum over M training data points
  in the training data set, D.
 - Minimizes complexity of a factor graph, measured by the number of edges in the factor graph using dimension function
 .
.
The scoring function is repeatedly evaluated online on arrival of as events corresponding the system and attacker activity. Learning factor graph structure provides the best candidate factor graph to inference a current state of an attack in progress.
2. Learning a factor graph parameters (offline)
The goal of learning graph parameters is to automatically define parameters of factor functions, e.g.,  maps a set of input variables X to a real-value output. This learning parameter step is done offline. A parameter
  represents how the function does the mapping. A factor function can be represented as: i) a procedure or ii) a table (Figure 3(b)).
A procedure is a set of statements thus it is more intuitive in describing functionality of a function. In prior work, domain experts usually provide the procedure for specifying factor functions. However, a procedure representation is not computationally efficient because the statements must be evaluated whenever the function is evaluated. Automatic learning a set of statements is a difficult problem because of a large search space over a set of possible statements. On the other hand, a table only shows a set of possible input values and corresponding output values of the function, thus table representation is more computationally efficient.
Key challenges in learning factor functions are: i) incomplete data on the attacker behavior and ii) a large search space of possible factor functions. First, data on multi-stage attacks are rare and infrequently published due to their sensitive nature. In addition, not all attacks include a complete sequence of attack stages. Only a partial number of alerts are observed for initial or final stages because attackers cleared their traces. Second, the search space for a factor function is exponentially large for multivariate functions. We address those challenges as follows: (i) missing data are filled with their expected values using observed data and current estimation of parameter , this is the core idea of the Expectation Maximization (EM) algorithm that we use and (ii) we automate the process of learning factor functions by using tabular rather than procedural representation of the factor functions.