 Data Driven Security Models and Analysis - July 2017
Public Audience
Purpose: To highlight project progress. Information is generally at a higher level which is accessible to the interested public. All information contained in the report (regions 1-3) is a Government Deliverable/CDRL.
PI(s): Ravi Iyer
Co-PI(s): Zbigniew Kalbarczyk and Adam Slagell
Researchers: Phuong Cao and Key-whan Chung
HARD PROBLEM(S) ADDRESSED
This refers to Hard Problems, released November 2012.
- Predictive security metrics - design, development, and validation
- Resilient architectures - in the end we want to use the metrics to achieve a measurable enhancement in system resiliency, i.e., the ability to withstand attacks
- Human behavior - data contain traces of the steps the attacker took, and hence inherently include some aspects of the human behavior (of both users and miscreants)
PUBLICATIONS
Papers published in this quarter as a result of this research. Include title, author(s), venue published/presented, and a short description or abstract. Identify which hard problem(s) the publication addressed. Papers that have not yet been published should be reported in region 2 below.
No publications this quarter.
ACCOMPLISHMENT HIGHLIGHTS
This quarter we have continued our work on deployment of our automatic learning of factor graphs employed for preemptive detection of multi-stage attacks in large enterprise networks, e.g., HPC system and cloud infrastructure. Specifically, we installed our AttackTagger detector into live network traffic of NCSA's network to tag raw system and network logs with corresponding attack stages. The goal is to detect multi-stage attacks in a life system. In the following paragraphs, we describe our framework (see Figure 1) and implementation of AttackTagger that adapts to real-time tagging of raw system and network logs.
 Figure 1: Framework overview. Learning phase automatically extracts dependencies among observed events and attack stages, ranks them by strength and represents them by factor functions. Runtime deployment phase creates a factor graph for each user in the target system online, using processed raw logs and learned factor functions. Prediction phase runs iterative inference algorithm to predict an attack stage associated with observed events at a time step t. Best view in colors.
1. Results on learning of factor functions
In this section, we present our findings on learned factor functions that capture repeated event patterns observed in the past attacks. As an example, we highlight two representative security events that illustrate the scan attack stage. An early detection in scan stage is critical to stop a multi-stage attack from evolving.
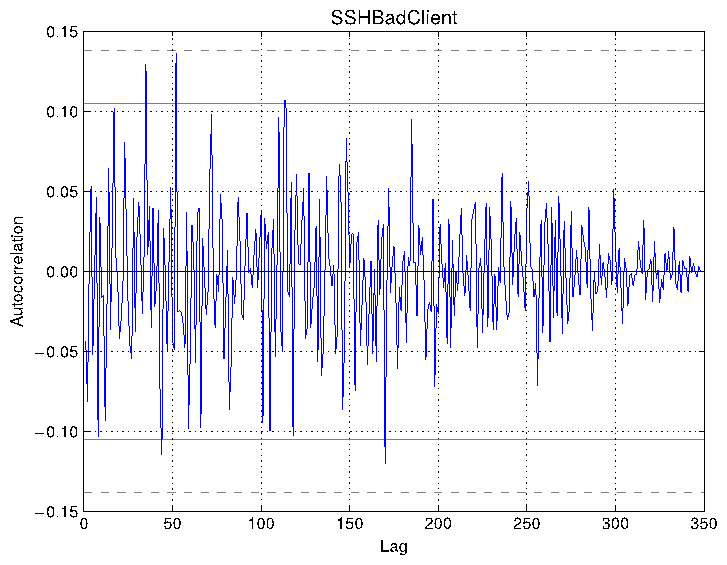
Autocorrelation on a single event. We show an example of autocorrelation plots on two repeatable events that are often observed in real-world attacks. Figure 1 and Figure 2 show autocorrelation of two events (SSLWeakKey) and (SSHBadClient) in 1400 seconds period. The x-axis shows 350 time bucket from 0 to 350, each time bucket corresponds to a 4-second period; the y-axis shows the autocorrelation. A point (x,y) represents the autocorrelation between the frequency of an event at a time bucket 350+1 and the frequency of such event at a time bucket . When an event is a repeating event, we would expect a decreasing sine-wave like pattern in the autocorrelation plot.
In Figure 2, SSLWeakKey is an infrequent event where a user accesses a website using outdated certificate, e.g., RC4 40-bit key in SSL 3.0 instead of AES 2048-bit key in TLS 1.3. There is no discernible pattern in the event SSLWeakKey as shown in Figure 2.
 Figure 2: Autocorrelation of SSLWeakKey event
 Figure 3: Autocorrelation of SSHBadClient event
In Figure 3, SSHBadClient is a frequent event indicating SSH scanning activities or using SSH scanning as a mean of covert channel communication. The autocorrelation plot reveals that SSHBadClient is a repeating event. In this example, the learned factor function for the event SSHBadClient is:
Based on such correlation, we learned a list of multi-variate factor functions for capturing such repeated events and associated attack stages.
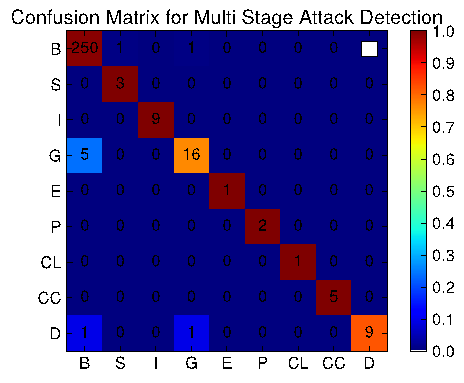
Based on our dataset of past attacks at NCSA and high-impact attacks from CVE repository, we selected the top 20 attacks that satisfy following criteria's: i) contain sufficient number of events to be a multi-stage attack, ii) contain both events of legitimate and malicious users. We have integrated our approach with Bro IDS using the Brocolli event protocols. As an event, i.e., a Bro NOTICE log, in an attack is observed, a hook in the Brocolli event protocol redirects the event to the sliding window, allows construction of factor graph in real-time and output of a the most probable attack stage. To evaluate accuracy, we compare the output from our tool with the ground truth and plot the confusion matrix for attack stages (Figure 4).

Figure 4: Confusion Matrix for Multi Stage Attack Detection (B-Benign, S-Scan, I-Init, G-Gather, E-Escalate, P-Persist, CL-Clear, CC-Command, D-Deliver). Best view in colors.
A row in the confusion matrix shows detection result of our approach for all attacks in the corresponding stage. For example, the last row (D) illustrates that there are 11 attacks that has progressed until the delivery stage. Our approach has identified 9 of them correctly, however, it mistakenly identified one attack as in Gather stage and one attack as in Benign stage. The reason is that, there were insufficient number of events observed in such attacks for making a decision. The host and network activity monitors only output two events: i) ssh between internal hosts and ii) typing an anomalous command, which is insufficient for our factor graph model to make a correct decision.
On detecting benign users, our approach has a low false positive rate. For example, the first column (B) shows that there are 256 benign users and our approach correctly identified 250 of them (97.7%); for 5 of the benign users our approach mistakenly identified them as in Gather stage, and 1 of them as in Delivery stage. The reason for misdetection is because such users exhibited a similar behavior as an attacker, e.g., a user download a file with a sensitive extension which looks like an attacker trying to obtain a source code of an exploit.
In overall, our approach correctly identified most of the attacks and their corresponding stages, as shown in the numbers in diagonal of the confusion matrix. For example, the first three cells in the diagonal of the confusion matrix shows that our approach correctly identified 3 attacks in Scan stage, 9 attacks in Init stage, 16 attacks in Gather stages.
3. Results on detecting other high-profile attacks
We demonstrate that our approach can detect real-world malware in the wild and their variants. We selected three recent malware (see Table 1) that have been widely spread using stolen credentials or high severity vulnerabilities.

Figure 5: Attack stages transitions of three multi-stage attacks: a) SSH keylogger at NCSA; b) WannaCry ransomware; c) MacSpy malware as a service. Observed attack stages are: : scan; : gather; : escalate; : persist; : command; : deliver. The three attacks involve a common event subsequence associated with attack stages.
Three real-world malware that has common attack stages:
SSH keylogger: SSH keylogger injects credential-logging code into the OpenSSH server service, a popular secure remote login server for Linux servers.
WannaCry: WannaCry is a ransomware that spreads by exploiting vulnerabilities in Server Message Block (SMB) file sharing functionality of Windows machines.
MacSpy: MacSpy is a spyware that allows an unauthorized, remote user to control and extract data such as screenshots, key logs, and voice, from macOS machines.
A common characteristic of the three malware is that, they involved a sequence of attack stages, with a transition from one stage to another as shown in Figure 5. Such common sequence has been identified by our common sequence factor function for a sequence of alerts: (Network Scan, Download of Sensitive File Extension, Installation of New System Services, and Communication with high-risk Domains). These alerts correspond with following attack stages as identified by our approach in Figure 5. While the SSH keylogger stops spreading at the delivery stage, WannaCry continuously spreads by transitioning back from the delivery stage to the scan stage; and MacSpy continuously collect information by transitioning from the delivery stage to the gather stage. While IDSes can output alerts for an individual event, e.g., alert for the installation of a new system service. Such alerts are not actionable because the IDSes does not consider other past alerts. In contrast, our approach has been able to identify such malware stage-by-stage as alerts are observed by using the common sequence factor function (Figure 5).


