
 Visualizing the CAT Vehicle with rviz
The goal of this tutorial is to see the CAT Vehicle through the rviz utility. rviz allows you to interact with ROS topics, whether you are in simulation or in reality, so its use is sometimes more applicable to doing experiments with the CAT Vehicle platform, instead of the CAT Vehicle as catvehicle.
Start up rviz
Load a new tab and (from your workspace root) start rviz, after sourcing the setup.bash
$ source devel/setup.bash
$ rosrun rviz rviz
[ INFO] [1485978200.191455903]: rviz version 1.11.14
[ INFO] [1485978200.191636610]: compiled against Qt version 4.8.6
[ INFO] [1485978200.191730599]: compiled against OGRE version 1.8.1 (Byatis)
[ INFO] [1485978200.487411650]: Stereo is NOT SUPPORTED
[ INFO] [1485978200.487672732]: OpenGl version: 2.1 (GLSL 1.2).
You won't see much here, but that's OK: we're going to add some topical information.
Open a config file using the catvehicle.rviz boostrap
If you are anxious just to view the data straightaway, head over to Files->catvehicle->catvehicle.rviz.tgz to download a pre-fabricated rviz file that has lots of data already in it. Follow the extract instructions on that file page in order to put the file in the correct place for rviz to find it by default.
Add in data by topic
In this section of the tutorial, we will add in data streams to your rviz, as they seem interesting.
Find "Add" in the "Displays" panel, and then select the "By topic" tab. Select the "PointCloud2" type, which is the /catvehicle/velodyne_points topic, and make sure you select the Fixed Frame to be catvehicle/velodyne_link (which is the frame of the velodyne sensor).
You may need to zoom in/out to see the points, and actually they are kind of tricky to see. I like to make the points all very big, so let's do that by looking at the PointCloud in the Displays panel, and selecting "Size (m)", which (by default) is 0.01. Change this to 0.5, and you should have no trouble seeing the data points discovered by the simulated Velodyne sensor. Finally, change the "Color Transformer" to "Axis Color" which clearly shows (by RGB difference) the height of the return values of the sensors.
What we see now are data from the lidar sensor, but it would make more sense if we could see the car. To do this, add a new element to the Displays tab.
Add->By Display Type->RobotModel
You will, likely, see a Status Error now, and the error "Parameter [robot_description] does not exist, and was not found by searchParam()"
Never fear: we just need to adjust two elements of the display.
- Change Robot Description to catvehicle/robot_description
- Change TF Prefix to catvehicle
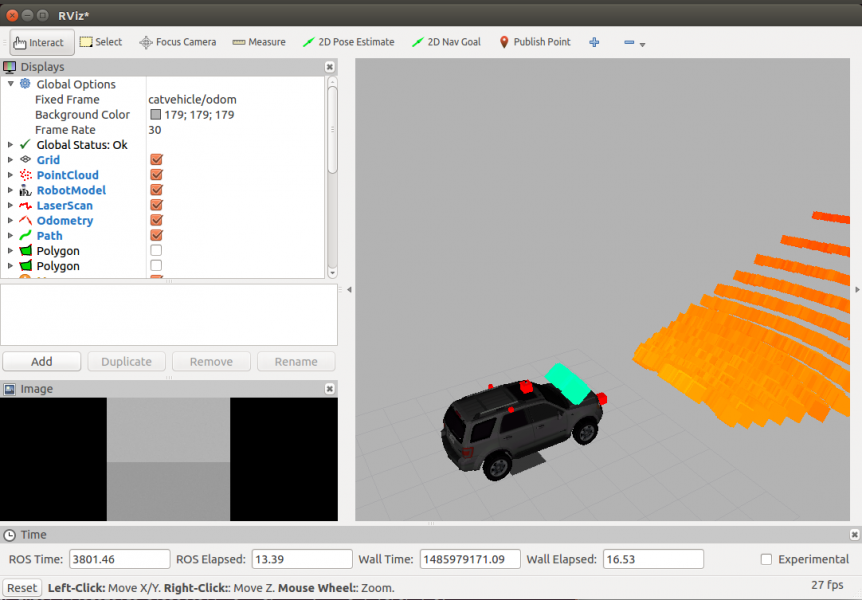
Now you should see the car "floating" below the grid. To see the car with the grid as the nominal floor of the world, adjust the "Fixed Frame" to be "catvehicle/odom" (the odometry frame of reference).
In later tutorials I will suggest adding things like "odometry" and "path" as display items. In any case, I suggest to go ahead and save this as an rviz config file, call it 'catvehicle_tutorial.rviz' (it will be saved in your ~/.rviz directory).
What's next?
These simulated sensor data don't look at interesting though: let's load a new world file that has features we can detect with our sensors.
azcar_sim (deprecated)
All information below this line is for v1 of the simulator, and will be removed.
The goal of this tutorial is to see the CAT Vehicle through the rviz utility. rviz allows you to interact with ROS topics, whether you are in simulation or in reality, so its use is sometimes more applicable to doing experiments with the CAT Vehicle platform, instead of the CAT Vehicle as azcar_sim.
Start up rviz
Load a new tab and start rviz (after sourcing the setup.bash)
$ source devel/setup.bash $ rosrun rviz rviz [ INFO] [1464396946.076121009]: rviz version 1.11.14 [ INFO] [1464396946.076178912]: compiled against Qt version 4.8.6 [ INFO] [1464396946.076191651]: compiled against OGRE version 1.8.1 (Byatis) [ INFO] [1464396946.312217837, 3003.816000000]: Stereo is NOT SUPPORTED [ INFO] [1464396946.312442542, 3003.816000000]: OpenGl version: 2.1 (GLSL 1.2).You won't see much here, but that's OK: we're going to add some topical information.
Find "Add" in the "Displays" panel, and then select the "By topic" tab. Select the "PointCloud2" type, which is the /azcar_sim/lidar_points topic, and make sure you select the Fixed Frame to be azcar_sim/laser_link (which is the frame of the velodyne sensor).
You may need to zoom in/out to see the points, and actually they are kind of tricky to see. I like to make the points all very big, so let's do that by looking at the PointCloud in the Displays panel, and selecting "Size (m)", which (by default) is 0.01. Change this to 0.5, and you should have no trouble seeing the data points discovered by the simulated Velodyne sensor. Finally, change the "Color Transformer" to "Axis Color" which clearly shows (by RGB difference) the height of the return values of the sensors.
What we see now are data from the lidar sensor, but it would make more sense if we could see the car. To do this, add a new element to the Displays tab.
Add->By Display Type->RobotModel
You will, likely, see a Status Error now, and the error "Parameter [robot_description] does not exist, and was not found by searchParam()"
Never fear: we just need to adjust two elements of the display.
- Change Robot Description to azcar_sim/robot_description
- Change TF Prefix to azcar_sim
Now you should see the car "floating" below the grid. To see the car with the grid as the nominal floor of the world, adjust the "Fixed Frame" to be "azcar_sim/odom" (the odometry frame of reference).
In later tutorials I will suggest adding things like "odometry" and "path" as display items. In any case, I suggest to go ahead and save this as an rviz config file, call it 'azcar_sim.rviz' (it will be saved in your ~/.rviz directory).
These simulated sensor data don't look at interesting though: let's load a new world file that has features we can detect with our sensors.